
The warehouse space utilization formula is simple. Applying it correctly, and actually moving the number, requires understanding inventory type, racking systems, clear height, and operational workflow. This guide covers all of it: how to define and calculate utilization, what determines your ideal rate, the most common calculation mistakes, and the physical and operational changes that deliver real gains.
Key Takeaways
- Warehouse space utilization measures what percentage of available cubic capacity is actively holding inventory
- The formula: (Used Space ÷ Total Available Space) × 100
- Target range varies by operation — inventory type, turnover velocity, and racking systems all influence what's achievable and safe
- Pushing utilization too high creates congestion, picking errors, and safety hazards — optimization matters more than raw maximization
- Top gains come from combining vertical storage infrastructure with slotting and inventory rationalization
What Is Warehouse Space Utilization?
Warehouse space utilization is a KPI that expresses how much of a facility's available storage capacity is actively in use, measured as a percentage. The critical word is cubic — this metric is calculated in cubic feet, not square footage, because it captures vertical storage potential as well as floor area.
That distinction matters more than most operations realize. As CBRE Investment Management notes, warehouse tenants pay rent on square footage but store product on a cubic basis — meaning a facility with 30-foot clear heights and floor-stacked pallets is leaving enormous capacity on the table even if the floor looks packed.
Why This KPI Matters
The utilization rate tells a different story depending on where it lands:
- Too low: You're paying rent on space that isn't generating return — overhead cost per stored unit climbs unnecessarily
- Too high: Congestion builds at pick locations, safety margins shrink, and fulfillment slows as equipment and personnel compete for space
- In range: Cost per unit drops, inventory visibility improves, and fulfillment flow runs without bottlenecks
The target rate for most operations falls around 80–85%, but your right number depends on product mix, turnover rate, and pick method. Chasing someone else's benchmark without accounting for those variables leads to either wasted space or gridlock on the floor.
How to Calculate Warehouse Space Utilization
Accurate calculation requires two volumetric measurements — total available storage capacity and total space currently occupied — both expressed in cubic feet.
Step 1: Determine Total Available Storage Capacity
- Measure total floor area in square feet
- Subtract all non-storage areas — offices, restrooms, break rooms, staging zones, dock areas, and fixed aisle space
- Multiply usable floor area by clear height — the distance from floor to the lowest overhead obstruction (beam, light fixture, sprinkler head)
The result is your total available cubic storage capacity.
Example: 120,000 sq. ft. total floor area − 20,000 sq. ft. non-storage = 100,000 sq. ft. usable storage × 24 ft. clear height = 2,400,000 cubic feet of available capacity
Step 2: Calculate the Volume of Stored Inventory
Following Prologis's storage measurement methodology, multiply rack length and width by the tallest load height in each storage area, then sum the cubic volumes across all areas. For pallet-based operations, this means calculating the total volume of each pallet position in use.
Accurate inventory records or a WMS make this step far faster — manual measurement across hundreds of SKUs is time-consuming and invites error.
Step 3: Apply the Formula
Warehouse Space Utilization (%) = (Used Space ÷ Total Available Space) × 100
Example: 1,440,000 cubic feet in use ÷ 2,400,000 cubic feet available × 100 = 60% utilization
Interpreting the result:
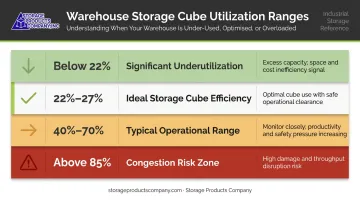
| Utilization Range | What It Signals |
|---|---|
| Below 22% | Significant underutilization; rack locations likely inefficient |
| 22%–27% (storage cube use) | Prologis's cited ideal range for storage cube efficiency |
| 40%–70% | Typical operational range for many facilities |
| Above 85% | Congestion risk, picking slowdowns, safety concerns at peak |
What Determines Your Ideal Utilization Rate?
No single percentage applies across all operations. The right target for your facility depends on inventory characteristics, workflow requirements, and the storage systems you have in place.
Inventory Type and Stackability
Products with irregular shapes, fragile packaging, or variable dimensions can't be stored as densely as standard palletized goods. Facilities handling these items often operate at lower utilization percentages not because of poor planning, but because the inventory itself demands more space per unit.
Uniformly sized, palletized goods with good stackability support higher density, and the racking systems that serve them can be configured for maximum cubic efficiency.
Expiration Dates and Turnover Velocity
Date-sensitive inventory (food, cosmetics, pharmaceuticals) requires FIFO rotation and consistent accessibility throughout the storage area. You can't block product behind other product when shelf life is a factor.
FIFO-compatible racking systems (pallet flow, carton flow, drive-thru rack) are designed for this scenario. As defined by the Rack Manufacturers Institute, pallet-flow and case-flow racks load from one service aisle and unload from another — preserving FIFO order while maintaining density. Operations storing perishable goods typically target lower utilization percentages to maintain product flow and reduce spoilage risk.
Low-turnover, non-perishable goods tell a different story: they can sit at greater density without creating workflow problems. Drive-in rack, which loads and unloads from the same aisle, suits these environments well — Storage Products Company's drive-in/drive-thru systems can store up to 75% more pallets than conventional selective rack by eliminating aisle penetration.
Vertical Space and Storage System Design
Two warehouses with identical floor footprints can have dramatically different cubic capacities based on clear height and the racking systems installed. Modern facilities target 36–40 ft. clear heights versus 18–32 ft. in older buildings. That gap translates directly into pallet positions per square foot of floor area.
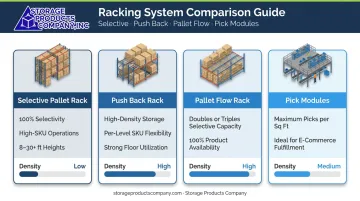
The right racking configuration is one of the highest-leverage decisions a warehouse makes for long-term space performance:
- Selective pallet rack: best for high-SKU operations requiring 100% selectivity; available in heights from 8 ft. to 30+ ft.
- Push back rack: high-density storage with per-level SKU flexibility; strong floor space utilization
- Pallet flow rack: doubles or triples the capacity of selective rack while maintaining 100% product availability
- Pick modules: concentrate picks per square foot; ideal for e-commerce and multi-SKU fulfillment
Storage Products Company provides AutoCAD-based layout design services that model these configurations against your actual floor plan, clear height, and equipment constraints before any rack is ordered or installed.
SKU Count and Operational Workflow
High-SKU operations need more picking access lanes, organized aisle structures, and staging room. All of that consumes floor space and reduces the utilization percentage that can be maintained without sacrificing efficiency.
Receiving zones, packing stations, and outbound shipping areas must be factored into the usable space calculation and excluded from the denominator when setting a realistic utilization target.
Common Mistakes That Hurt Your Utilization Rate
Measuring Floor Area Instead of Cubic Volume
Square footage alone tells an incomplete story. A warehouse with 30-foot ceilings and floor-level pallet stacks may look "full" on a floor plan while using a fraction of its actual cubic capacity. The formula only works when both measurements are volumetric — height included.
Including Non-Storage Zones in the Denominator
Offices, dock areas, restrooms, and aisle space don't hold inventory. Including them in "total available space" artificially deflates the utilization rate. If your facility's utilization looks lower than expected, check whether non-storage zones are inflating the denominator.
Chasing Maximum Utilization
Push utilization above 85% and operations start breaking down in predictable ways:
- Congestion builds at peak receiving and shipping periods
- Pick errors increase as aisles tighten
- Order fulfillment slows
- Safety risks grow for personnel and equipment in confined spaces
The target is an optimized rate, not the highest possible rate. WERC's 2025 DC Measures report tracks both average and peak warehouse capacity as separate key metrics for exactly this reason: a facility running smoothly at 65% average can hit dangerous congestion at 90% during peak periods.
How to Optimize Warehouse Space Utilization
Physical infrastructure changes tend to deliver the most structural gains. Operational practices sustain and refine them. Both need to work together.
Optimize Layout and Aisle Configuration
A well-designed layout minimizes dead space, reduces travel distance, and ensures goods flow logically from receiving through storage, picking, and shipping. Standard warehouse aisles for counterbalanced lift trucks run approximately 12 ft. Narrow-aisle forklifts can operate in 9–10 ft. aisles, and very-narrow-aisle (VNA) equipment can work in aisles as narrow as 6 ft., according to Modern Materials Handling. Transitioning to narrower aisles where equipment and safety clearances allow can recover significant floor area for additional storage.
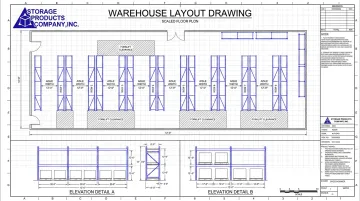
Layout redesign should start with accurate floor plan modeling. Storage Products Company's AutoCAD layout service produces scaled drawings — rack elevations, plan views, aisle layouts, equipment placement — so facilities can visualize utilization improvements before committing to physical changes.
Maximize Vertical Space with the Right Storage Systems
Extending racking to use full ceiling clear height increases cubic capacity without expanding the building footprint. The same 100,000 sq. ft. storage floor at 24 ft. clear height holds 2.4M cubic feet. At 36 ft., it holds 3.6M — 50% more capacity from the same real estate.
Beyond standard selective rack, options include:
- Mezzanine platforms add an elevated second level for storage or pick operations where ceiling height and load allow (Cubic Designs, backed by Lifetime Structural Warranty and PE-stamped drawings)
- Multi-level pick modules combine carton flow at the pick face with pallet rack reserve above, more than doubling available SKUs in the same floor footprint
- Drive-in, drive-thru, and push back rack eliminate aisles entirely for high-density, lower-SKU environments
Choosing the wrong system can actually reduce utilization and create workflow problems. Storage Products Company's team assesses SKU profile, turnover velocity, and forklift compatibility as part of any racking recommendation , representing manufacturer lines including Frazier, UNARCO, and Cubic Designs across the full spectrum of storage configurations.
Implement a Warehouse Slotting Strategy
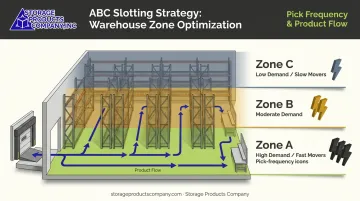
Slotting organizes inventory placement based on demand velocity, size, weight, and pick frequency. Velocity-based slotting places frequently picked items in the most accessible locations (near shipping and packing) while slower-moving items occupy harder-to-reach zones.
The practical framework is ABC analysis:
- A items (high demand) → ground-level, front-of-warehouse, near pack stations
- B items (moderate demand) → mid-zone, accessible but not prime real estate
- C items (low demand) → upper levels, rear locations, less-accessible rack positions
As Inbound Logistics describes, slotting organizes inventory to maximize efficiency and lower total warehousing operational costs , reducing pick travel time while improving space efficiency simultaneously.
Conduct Regular Inventory Audits and Rationalize SKUs
Slow-moving and obsolete inventory quietly ties up storage space that active, revenue-generating product needs. Regular audits identify these items so operations can liquidate, discount, or return them to suppliers and reclaim that capacity.
SKU rationalization is a proven lever. When Supply Chain Dive covered inventory strategy in 2023, several major retailers had already acted on this:
- Under Armour cut its SKU count by 25%
- Macy's reduced inventory by 7%
- Kohl's reduced inventory by 6%
In high-SKU warehouses, eliminating redundant or underperforming product variants reduces storage complexity and directly improves utilization rates.
Improve Demand Forecasting
Inaccurate forecasting leads to overstocking (which crowds storage and pushes utilization past safe thresholds) or understocking, which wastes paid capacity. Reviewing historical sales data seasonally and investing in better forecasting tools keeps inventory levels aligned with actual storage targets, preventing both problems.
Frequently Asked Questions
What is warehouse space utilization?
Warehouse space utilization is a KPI expressed as a percentage that measures how much of a facility's total available cubic storage capacity is actively holding inventory. It helps operations identify whether their facility is being used efficiently or whether paid square footage is going to waste.
How do you calculate warehouse space utilization?
Apply the formula: (Used Space ÷ Total Available Space) × 100. Total available space equals usable floor area (excluding non-storage zones) multiplied by clear height. Used space is the total cubic volume of all stored inventory across active storage locations.
What is the optimal warehouse space utilization rate?
The right rate depends on inventory type, turnover velocity, and storage system design — there's no single target that fits every operation. Most facilities aim to stay below 85% to preserve safe movement and workflow flexibility during peak periods. Prologis cites 22%–27% as an ideal storage cube use range for overall design efficiency.
How do you optimize warehouse space utilization?
The most impactful approaches: redesign the layout to reduce dead space and aisle width where equipment allows, extend racking to use full ceiling clear height, implement velocity-based slotting to put fast movers in accessible locations, and conduct regular audits to eliminate slow-moving stock consuming prime real estate.
What is an example of space utilization?
If a warehouse has 2,400,000 cubic feet of total available storage and 1,440,000 cubic feet are occupied by inventory, utilization is (1,440,000 ÷ 2,400,000) × 100 = 60% — within a healthy operational range for most facilities.
What KPIs should I track alongside warehouse space utilization?
WERC's 2025 DC Measures report identifies average warehouse capacity used, peak warehouse capacity used, order-picking accuracy, and dock-to-stock cycle time as top benchmarked distribution metrics. Track peak utilization alongside average utilization — a facility that looks healthy on average can hit dangerous congestion during peak periods.